Kavi's BGGN 213 Portfolio

Class work for bioinformatics class
Class 17
Kavi (PID: A69046927)
ENSEMBL/OMIM Calculations
library(dplyr)
Attaching package: 'dplyr'

The following objects are masked from 'package:stats':

    filter, lag

The following objects are masked from 'package:base':

    intersect, setdiff, setequal, union
read.csv("MXL_genotypes.csv") -> MXL_genotypes
table(MXL_genotypes)
, , Population.s. = ALL, AMR, MXL, Father = -, Mother = -

                            Genotype..forward.strand.
Sample..Male.Female.Unknown. A|A A|G G|A G|G
                 NA19648 (F)   1   0   0   0
                 NA19649 (M)   0   0   0   1
                 NA19651 (F)   1   0   0   0
                 NA19652 (M)   0   0   0   1
                 NA19654 (F)   0   0   0   1
                 NA19655 (M)   0   1   0   0
                 NA19657 (F)   0   1   0   0
                 NA19658 (M)   1   0   0   0
                 NA19661 (M)   0   1   0   0
                 NA19663 (F)   1   0   0   0
                 NA19664 (M)   0   0   1   0
                 NA19669 (F)   1   0   0   0
                 NA19670 (M)   1   0   0   0
                 NA19676 (M)   0   0   0   1
                 NA19678 (F)   1   0   0   0
                 NA19679 (M)   0   1   0   0
                 NA19681 (F)   0   1   0   0
                 NA19682 (M)   0   1   0   0
                 NA19684 (F)   0   1   0   0
                 NA19716 (F)   0   0   1   0
                 NA19717 (M)   0   1   0   0
                 NA19719 (F)   0   0   0   1
                 NA19720 (M)   0   0   0   1
                 NA19722 (F)   0   0   1   0
                 NA19723 (M)   0   0   0   1
                 NA19725 (F)   0   1   0   0
                 NA19726 (M)   1   0   0   0
                 NA19728 (F)   1   0   0   0
                 NA19729 (M)   0   1   0   0
                 NA19731 (F)   1   0   0   0
                 NA19732 (M)   0   1   0   0
                 NA19734 (F)   0   0   1   0
                 NA19735 (M)   0   0   0   1
                 NA19740 (F)   1   0   0   0
                 NA19741 (M)   1   0   0   0
                 NA19746 (F)   1   0   0   0
                 NA19747 (M)   0   0   1   0
                 NA19749 (F)   0   1   0   0
                 NA19750 (M)   0   1   0   0
                 NA19752 (F)   0   1   0   0
                 NA19755 (F)   1   0   0   0
                 NA19756 (M)   0   0   1   0
                 NA19758 (F)   0   1   0   0
                 NA19759 (M)   0   0   1   0
                 NA19761 (F)   0   0   1   0
                 NA19762 (M)   1   0   0   0
                 NA19764 (F)   1   0   0   0
                 NA19770 (F)   0   1   0   0
                 NA19771 (M)   1   0   0   0
                 NA19773 (F)   1   0   0   0
                 NA19774 (M)   0   1   0   0
                 NA19776 (F)   0   1   0   0
                 NA19777 (M)   1   0   0   0
                 NA19779 (F)   0   0   1   0
                 NA19780 (M)   1   0   0   0
                 NA19782 (F)   0   0   1   0
                 NA19783 (M)   0   1   0   0
                 NA19785 (F)   1   0   0   0
                 NA19786 (M)   0   0   1   0
                 NA19788 (F)   0   1   0   0
                 NA19789 (M)   0   0   0   1
                 NA19792 (M)   1   0   0   0
                 NA19794 (F)   0   0   1   0
                 NA19795 (M)   0   1   0   0
sum(MXL_genotypes$Genotype..forward.strand.=="G|G") -> homoz_numb
all_numb = count(MXL_genotypes)
homoz_prop <- (homoz_numb/all_numb) * 100
homoz_prop
        n
1 14.0625
DESeq Analysis
genereads <- read.table("genereads.txt", header=TRUE, row.names=1)

summary(genereads)
    sample              geno                exp
 Length:462         Length:462         Min.   : 6.675
 Class :character   Class :character   1st Qu.:20.004
 Mode  :character   Mode  :character   Median :25.116
                                       Mean   :25.640
                                       3rd Qu.:30.779
                                       Max.   :51.518
aa <- sum(genereads$geno == "A/A")
ag <- sum(genereads$geno == "A/G")
gg <- sum(genereads$geno == "G/G")
Q13 Sample Size
There are 108 individuals with A/A genotype, 233 individuals with
A/G genotype, and 121 individuals with G/G genotype.
Median expression provided in boxplot for Q14.
Q14 Box Plot
library(ggplot2)
ggplot(genereads) +
  aes(x=geno,y=exp) +
  theme_classic() +
  geom_boxplot() +
   stat_summary(
    fun = median,
    geom = "text",
    aes(label = round(..y.., 2)),
    vjust = -0.5,
    color = "red"
  ) +
  labs(x="Genotype", y="Expression Level") +
  geom_jitter(alpha=0.2, width = 0.2)
Warning: The dot-dot notation (`..y..`) was deprecated in ggplot2 3.4.0.
ℹ Please use `after_stat(y)` instead.
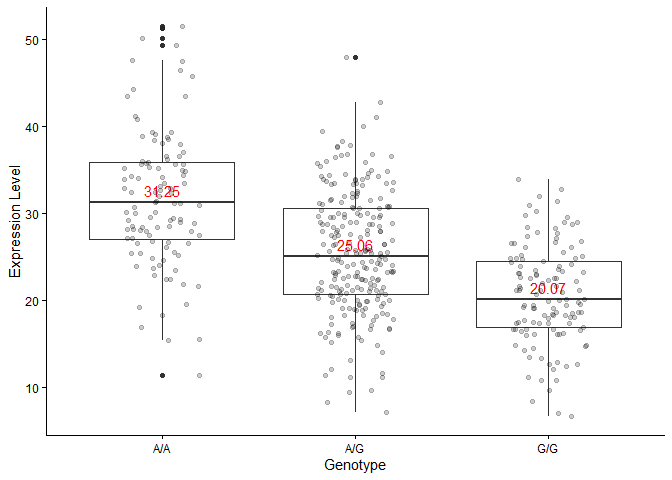
Response to Q14
From the boxplot, I can infer that the more copies there are of the SNP allele variant, the lower the expression of ORMDL3. The allele inhibits proper expression of ORMDL3.